Financial Analytics · Python
Data-Driven Portfolio Analysis
A Python analytics project exploring how data can be used to evaluate diversification, measure portfolio characteristics and understand risk-return trade-offs across multiple asset classes.
Problem
How should an investor think about risk, return, and diversification when combining equities, treasuries, gold, and international exposure?
Approach
Downloaded market data with yfinance
Computed daily returns and annualized metrics
Built a correlation matrix to assess diversification
Simulated 20,000 random portfolios
Estimated an efficient frontier
Identified max-Sharpe and min-variance portfolios
What it shows
Diversification is real and measurable
Lowest risk is not the same as best risk-adjusted return
Historical optimization is useful but not predictive
Tail risk and changing correlations still matter
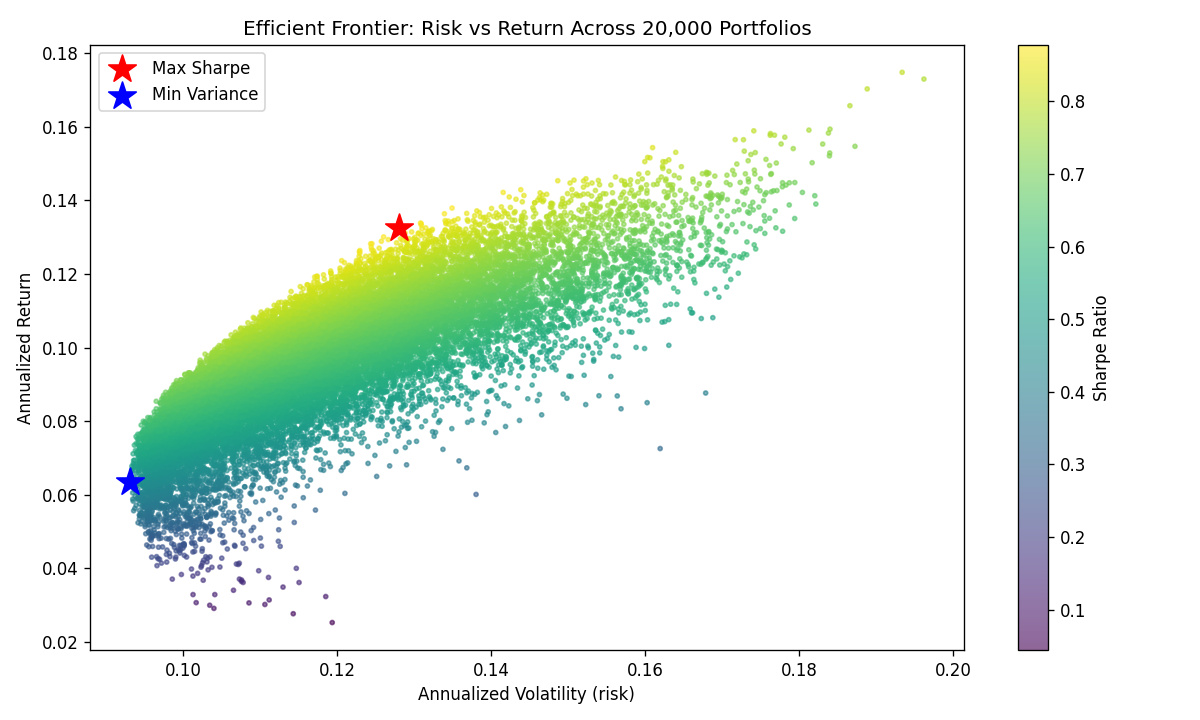
Historical portfolio simulations illustrate risk–return trade-offs; they are not forecasts.
View full-size chart ↗Key observations
Combining assets with low or negative correlation can improve risk-adjusted return. The max-Sharpe portfolio and the min-variance portfolio are different by design: optimizing for one is not the same as optimizing for the other.
Analytical limitations
These weights are backward-looking, correlations can change sharply in stress periods, and Sharpe ratio does not capture all forms of risk. The point is the reasoning, not a single recommended allocation.
Tools
Python, pandas, NumPy, matplotlib, yfinance
GitHub
Explore the Python implementation and supporting analysis on GitHub.
Open GitHub Repo